


Home
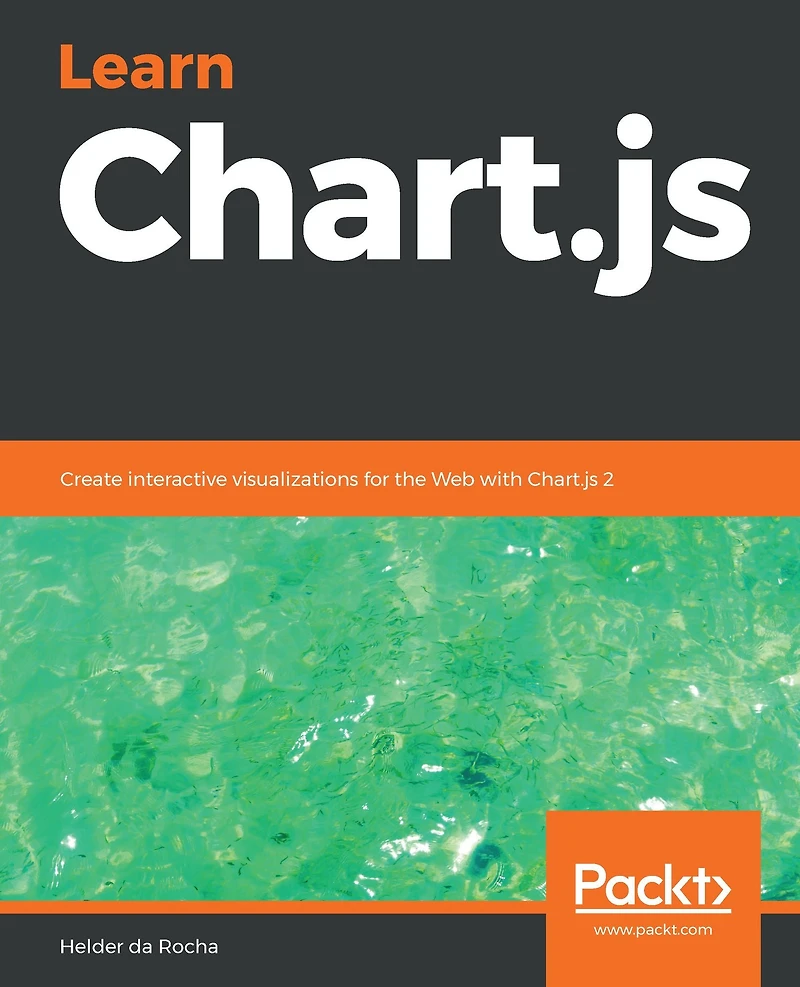
Learn Chart.js: Create interactive visualizations for the Web with Chart.js 2
Barnes and Noble
Loading Inventory...
Learn Chart.js: Create interactive visualizations for the Web with Chart.js 2 in Bloomington, MN
By Barnes & Noble
Current price: $23.99

Learn Chart.js: Create interactive visualizations for the Web with Chart.js 2 in Bloomington, MN
Current price: $23.99
Loading Inventory...
Size: EBook
Design interactive graphics and visuals for your data-driven applications using the popular open-source Chart.js data visualization library.Key Features Harness the power of JavaScript, HTML, and CSS to create interactive visualizations Display quantitative information efficiently in the form of attractive charts by using Chart.js A practical guide for creating data-driven applications using open-source JavaScript library Book DescriptionChart.js is a free, open-source data visualization library, maintained by an active community of developers in GitHub, where it rates as the second most popular data visualization library. If you want to quickly create responsive Web-based data visualizations for the Web, Chart.js is a great choice.This book guides the reader through dozens of practical examples, complete with code you can run and modify as you wish. It is a practical hands-on introduction to Chart.js. If you have basic knowledge of HTML, CSS and JavaScript you can learn to create beautiful interactive Web Canvas-based visualizations for your data using Chart.js. This book will help you set up Chart.js in a Web page and show how to create each one of the eight Chart.js chart types. You will also learn how to configure most properties that override Chart’s default styles and behaviors. Practical applications of Chart.js are exemplified using real data files obtained from public data portals. You will learn how to load, parse, filter and select the data you wish to display from those files. You will also learn how to create visualizations that reveal patterns in the data. This book is based on Chart.js version 2.7.3 and ES2015 JavaScript.By the end of the book, you will be able to create beautiful, efficient and interactive data visualizations for the Web using Chart.js.What you will learn Learn how to create interactive and responsive data visualizations using Chart.js Learn how to create Canvas-based graphics without Canvas programming Create composite charts and configure animated data updates and transitions Efficiently display quantitative information using bar and line charts, scatterplots, and pie charts Learn how to load, parse, and filter external files in JSON and CSV formats Understand the benefits of using a data visualization framework Who this book is forThe ideal target audience of this book includes web developers and designers, data journalists, data scientists and artists who wish to create interactive data visualizations for the Web. Basic knowledge of HTML, CSS, and JavaScript is required. No Canvas knowledge is necessary.
Design interactive graphics and visuals for your data-driven applications using the popular open-source Chart.js data visualization library.Key Features Harness the power of JavaScript, HTML, and CSS to create interactive visualizations Display quantitative information efficiently in the form of attractive charts by using Chart.js A practical guide for creating data-driven applications using open-source JavaScript library Book DescriptionChart.js is a free, open-source data visualization library, maintained by an active community of developers in GitHub, where it rates as the second most popular data visualization library. If you want to quickly create responsive Web-based data visualizations for the Web, Chart.js is a great choice.This book guides the reader through dozens of practical examples, complete with code you can run and modify as you wish. It is a practical hands-on introduction to Chart.js. If you have basic knowledge of HTML, CSS and JavaScript you can learn to create beautiful interactive Web Canvas-based visualizations for your data using Chart.js. This book will help you set up Chart.js in a Web page and show how to create each one of the eight Chart.js chart types. You will also learn how to configure most properties that override Chart’s default styles and behaviors. Practical applications of Chart.js are exemplified using real data files obtained from public data portals. You will learn how to load, parse, filter and select the data you wish to display from those files. You will also learn how to create visualizations that reveal patterns in the data. This book is based on Chart.js version 2.7.3 and ES2015 JavaScript.By the end of the book, you will be able to create beautiful, efficient and interactive data visualizations for the Web using Chart.js.What you will learn Learn how to create interactive and responsive data visualizations using Chart.js Learn how to create Canvas-based graphics without Canvas programming Create composite charts and configure animated data updates and transitions Efficiently display quantitative information using bar and line charts, scatterplots, and pie charts Learn how to load, parse, and filter external files in JSON and CSV formats Understand the benefits of using a data visualization framework Who this book is forThe ideal target audience of this book includes web developers and designers, data journalists, data scientists and artists who wish to create interactive data visualizations for the Web. Basic knowledge of HTML, CSS, and JavaScript is required. No Canvas knowledge is necessary.
Shop Similar Products








Find at Mall of America® in Bloomington, MN
Visit at Mall of America® in Bloomington, MN