Home
Revenue and Expense Planning for Small Business: Using Statistical Analytics
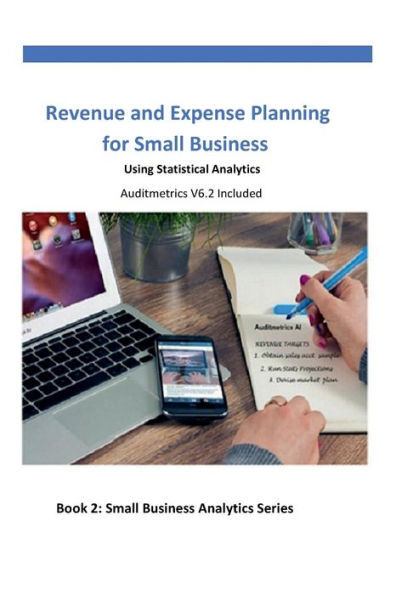
Revenue and Expense Planning for Small Business: Using Statistical Analytics
Current price: $12.95
Loading Inventory...
Size: Paperback
This book is Book #2 in a series which is designed as a resource for small businesses to improve cash flow. Book #1
sets the stage by being a resource in the use of methods to sample accounts to conduct statistical audits. This book follows up where Book #1 left off. It is designed to use the random samples discussed in book #1 to forecast future cash flow.
The use of statistical analytics in forecasting cash flow can involve complex procedures that may be beyond the experience of many small business managers. With this book and complimentary Auditmetrics software, the complexity of properly conducting account sampling can be greatly expedited. The software's use of AI assistance requires the manager to decide on only a few key targeted statistical measures such as margin of error and the software then guides the process through to the finished product of a random sample ready for forecasting analysis.
The issues fully discussed in this book is how to conduct statistical forecasts of cash flow. Separate statistical software is not necessary. Most business managers are familiar with Excel which offers a wide range of statistical functions. The Excel Analysis Toolpak is an add-on that provides the needed statistical tools. It is available with Microsoft Excel Professional. The MS Access database management system is recommended. It can be used to organize account data structures for analysis. The Excel statistical tools discussed include regression methods to forecast monthly cash flow including providing quarterly adjustments, controlling expenditures with the use of correlation techniques and non- linear regression techniques to project business plans that can be used in obtaining bank loans.
In this section is covered the statistical principles of analyzing empirically derived account data that is the underpinning of economic analysis. The fundamental idea covered is the uncertainty and variation of data used to help explore and understand the dynamics of the business fiscal environment. What leads to that uncertainty is data variation that is inherent in financial data. In this section is covered basic statistical measurements including central tendency, variation and uncertainty which is measured by the mean, standard deviation and probability. It is presented at a basic level for those who have minimal experience in statistics. It lays out the three major categories of statistical analytics: 1. descriptive statistics, 2. inferential statistics for decision making and 3. model building primarily using regression analysis for forecasting. For those who have taken courses in statistics, this will be a refresher that focuses on statistical methods used in economic analysis and market research.
In this Section is a discussion of using one of the very powerful tools in forecasting future economic activity, linear regression and correlation. It begins by covering the core principles of regression, starting with bivariate modeling and progressing to multiple and non-linear regression. The building and interpreting of regression output is accomplished by using MS Excel built-in functions with plenty of exhibits in the book. Though Excel can do all the regression calculations and outputs covered in this section, it is still important to be comfortable the underlying principles that is provided in Part I.